
Does the AI capability curve mean what we think? A statistical look at METR's time horizons
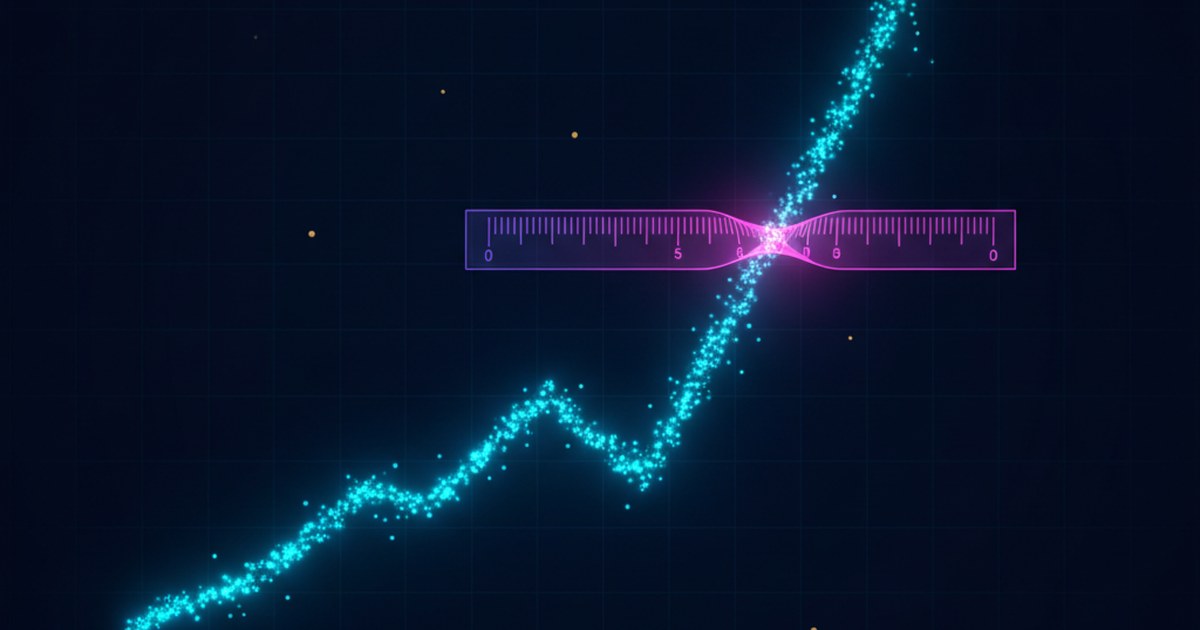
On 8 October 2026, two statisticians at UC Berkeley posted the first complete statistical audit of the chart that orients AI forecasting: METR's time-horizons plot [Nguyen and Fithian, 2026]. Working from METR's own published data (228 software tasks, 26 AI systems) Drew T. Nguyen and William Fithian rebuilt the plot without its central assumption: that a task's difficulty for an AI rises in a straight line with the logarithm of how long it takes a human expert. The exponential rise that made the chart famous survives; the authors state explicitly that they do not challenge it. What does not survive is the idea that a tenfold jump at one point on the curve represents the same advance as a tenfold jump at another. This is a preprint, not yet peer reviewed, and it changes no measurement. It changes how confidently any of us should quote one.
The chart that orients the field
METR's 50%-time horizon is precise by construction: it is the human expert completion time of a task that a given AI solves with 50% probability, estimated by fitting a logistic curve to the model's results across a task suite and reading off the crossing point [METR, 2026a]. GPT-4's estimated horizon is four minutes, meaning it completes a task a human would finish in four minutes half the time. The measure was introduced in March 2025 [Kwa et al., 2025] and has since become the field's default unit of agentic progress.
Its influence is not a matter of interpretation. The Berkeley preprint records the chart being compared to Moore's law by the New York Times, being likened to the Keeling Curve as an orienting instrument for AI risk, and being invoked in the slowdown debate that reached the US front page in summer 2026, all in the paper's introduction, which treats the plot as a public object rather than a benchmark [Nguyen and Fithian, 2026]. We have leaned on it here too: our September piece on Sam Altman's singularity claim cited the roughly seven-month doubling, and our benchmarks article cited the original paper directly.
METR has spent 2026 telling readers what the number is not. In January, one of the paper's lead authors wrote that a time horizon "is not the length of time AIs can work independently" but the serial human labour they can replace at a 50% success rate, that error bars have historically run about a factor of two in each direction, and of his own organisation's headline figure: "I really have no idea whether Claude's 'true' time horizon is 3.5h or 6.5h" [METR, 2026b]. The time-horizons page itself now carries two operational warnings: a correction to a regularization mistake made on 3 March 2026, and a notice added on 8 May 2026 that "measurements above 16 hrs are unreliable with our current task suite". On 8 September 2026, METR clarified that the page "is no longer actively updated" [METR, 2026a]. Any current claim anchored to it now needs a date attached.
What the reanalysis actually changed
The critique attacks an assumption, not a dataset. To turn task results into a single number, you must model how success probability falls as tasks get longer. METR's approach (and the baseline Nguyen and Fithian adopt) assumes the log-odds of success fall in a straight line against log human task time, with a shared slope across models [Barry, 2026; Nguyen and Fithian, 2026]. That straight line is what converts human minutes into AI difficulty. The authors replace it twice.
Their first model swaps the straight line for a single shared monotone curve fitted to all systems at once; the curve can be read directly as the conversion from human task time to AI difficulty. Their second is an item-response theory model in the Rasch tradition: every task carries a latent difficulty explained by its human time and its task family, with explicit allowance for the fact that repeated runs on the same task are correlated rather than independent [Nguyen and Fithian, 2026]. Both are fitted to METR's public Time Horizon 1.1 data (228 tasks, 26 systems, 79 task families) and judged by 12 proper scoring-rule metrics under five-fold cross-validation, splitting by task family so that no family leaks between training and test.
Two details of the design matter for honest reading. First, release dates are used nowhere in the fitting; they only position points on the chart afterwards. The authors are explicit: "the observed exponential growth is entirely empirical and we do not challenge it here" [Nguyen and Fithian, 2026]. Second, the baseline they try to beat is not even METR's original specification but the improved shared-slope variant from METR's own March 2026 note, which they replicate beats the original on 11 of the 12 metrics. This is a critique that first strengthens its target, then pushes on it.
The flat middle: 2–30 minutes
The headline finding is a shape. When the authors estimate the conversion from human time to AI difficulty without forcing it to be straight, it comes out nearly flat over tasks taking a human between two and thirty minutes: across that whole band, the tasks are roughly equally hard for AI systems, even though a human takes fifteen times longer at the top of the band than at the bottom [Nguyen and Fithian, 2026]. Elsewhere (below two minutes and above thirty) the conversion is close to the linear form METR assumes.
The arithmetic consequence is the sentence the abstract leads with: a time-horizon jump from three minutes to thirty is much easier than a jump from thirty minutes to five hours, despite both being a factor of ten. The paper's second diagnostic, which plots predicted success on fixed task lengths over release dates, shows the same thing from the other direction: the gap between the system with a four-minute horizon and the one with a fifteen-minute horizon is the smallest such step on the chart, and it is small across every conditional probability, not just at the 50% crossing.
This is where the numbers actually move. For the six systems whose published horizons sit between two and fifteen minutes, the revised estimates shift substantially (in some cases falling outside METR's original 95% confidence intervals) and most of the model's scoring advantage is earned in exactly this band [Nguyen and Fithian, 2026]. The mid-curve region, in other words, is where the straight-line assumption was doing the most damage. Above it, for the strongest systems, the three specifications nearly coincide.
Better scores, and a chart measuring something slightly different
On the numbers, both new models beat the baseline at point estimate on all 12 metrics, and on Murphy diagrams (which compare forecasts across every threshold at once) the baseline is nearly dominated above a success probability of 0.4 [Nguyen and Fithian, 2026]. The uncertainty estimates are honest about their own limits: intervals are clustered on task families, with 79 units, and for individual systems most intervals are still too wide to separate from zero. The evidence accumulates in the pooled comparison, not in any single model's row.
Underneath sits a finding about the data itself. If runs of the same model on the same task were independent, about 60% of run vectors would come out unanimous, all successes or all failures. In the actual data it is 83% [Nguyen and Fithian, 2026]. Repeated attempts behave as correlated draws, which is why the item-response model downweights pairs with many runs, and why treating 15,000 runs as 15,000 independent facts overstates how much the suite can tell you.
The most intriguing result is not about hours at all. When the authors plot their model's underlying capability estimates (the Rasch abilities, a pure scale of how capable each system is with no units attached) and rescale them against METR's published horizons, they match almost exactly, at an R² of 0.996, closer than the model's own revised time horizons [Nguyen and Fithian, 2026]. Their reading is careful: the linear fit, in this dataset, may have been quietly estimating a good capability index while labelling it hours. If the conversion from time to difficulty is not linear, the authors argue, the estimate should not be called a time horizon, though it may still be valuable as what they call Rasch ability. The ranking of the field survives. The ruler does not.
What the paper does not show
Four limits belong next to every headline drawn from this preprint. It has not been peer reviewed; the authors thank METR researchers in the acknowledgements and METR has not, as of publication, responded publicly. It analyses one suite of 228 self-contained, automatically scored software, machine-learning and cybersecurity tasks, and the authors say plainly that they assume, rather than test, the deeper construct-validity questions about whether such tasks represent real work. Their diagnostics are deliberately narrow, addressing only whether human time predicts difficulty and whether equal multiples mean equal advances.
Within that suite, the news is mostly good for the metric: human time predicts AI success strongly overall, and the flat band is a local defect rather than a general failure [Nguyen and Fithian, 2026]. Outside it, METR has already documented the drift. Its own domain follow-up found similar growth rates but absolute horizons 40 to 100 times lower on visual computer-use tasks [Kwa and Cheng, 2025; METR, 2026b]; the lead author's note puts one real-world coffee-making horizon at about two minutes. Human baseline conventions alone can move results by more than 25%, roughly 29% of tasks had no usable measured baseline and fall back on expert estimates, and longer tasks have the thinnest baselines of all, the one place where acceleration itself could be misjudged [Nguyen and Fithian, 2026; METR, 2026b]. Research the paper cites also found human time predicts AI success poorly across a broad set of economically relevant tasks.
Finally, the flat region is a property of this suite's short tasks, not a discovered law about intelligence, and the authors do not claim otherwise. Their discussion warns that if the benchmark is extended beyond a day (currently its limit), there is no reason the near-linear conversion should hold: the curve could flatten or steepen again, and a straight-line check would not notice. Their proposed diagnostic would.
What changed, what it means, what to watch
What changed. The canonical forecasting plot has been re-derived from its own data by an independent statistical team, with a better-scoring estimator and two diagnostics for the question everyone had been asking informally: does a tenfold jump mean the same thing everywhere? The answer, for the two-to-thirty-minute band, is no, and the correction moves some published horizons outside the confidence intervals METR originally reported for them.
What it means. Capability claims anchored to time horizons should be quoted as ranges tied to a region of the curve, not as stopwatch readings. The direction of travel (exponential growth on this suite) stands, and METR's own lead author has said the trend slope, not any single model's number, was always the important estimate [METR, 2026b]. But a "10x in N months" claim drawn from the middle of the curve is a smaller real advance than the same multiplier at the top or bottom, and doubling-time statements are trend statements about a benchmark, not measurements of autonomous working time. If you build forecasts, scenario plans or policy thresholds on this axis, the unit needs a confidence interval and the region needs a footnote.
What to watch. Whether METR answers (through its research notes, given that the chart page is no longer actively updated) and whether the revision is folded into future measurements or published as a parallel series. Whether peer review changes the estimates. Whether the next wave of time-horizon-based benchmarks, which the authors expect as the suite grows, ship with the conversion diagnostics attached. And whether the next doubling-time claim to travel the world arrives with the words "on this task suite" still attached to it.
References
[Nguyen and Fithian, 2026] Nguyen, D.T. & Fithian, W. (2026). "On the estimation and validity of AI time horizons — a statistical look at the METR plot." UC Berkeley, submitted 8 October 2026. Preprint, not peer reviewed. arXiv:2610.12466.
[Kwa et al., 2025] Kwa, T. et al. (2025). "Measuring AI Ability to Complete Long Software Tasks." NeurIPS 2025. arXiv:2503.14499.
[METR, 2026a] METR (2026). "Task-Completion Time Horizons of Frontier AI Models." Updates log: regularization correction 3 March 2026; 16-hour reliability notice 8 May 2026; "no longer actively updated" clarified 8 September 2026. metr.org.
[METR, 2026b] Kwa, T. (2026). "Clarifying limitations of time horizon." METR research note, 22 January 2026. metr.org.
[Barry, 2026] Barry, A. (2026). "Impact of modelling assumptions on time horizon results." METR research note, 20 March 2026. metr.org.
[Kwa and Cheng, 2025] Kwa, T. & Cheng, V. (2025). "How Does Time Horizon Vary Across Domains?" METR, 14 July 2025. metr.org.